
AI infographic generator
Infographics with charts drawn to your numbers.
Examples
From rows of numbers to one clear page.
- From one prompt
 Describe the headshot
 - Spreadsheet to infographic
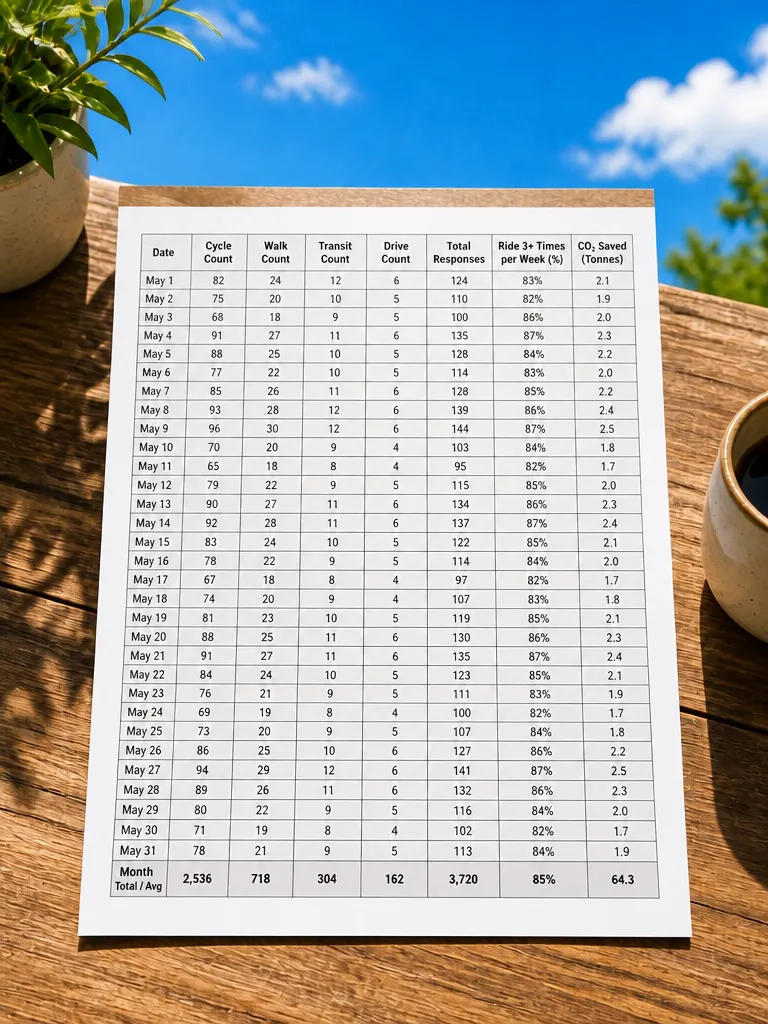
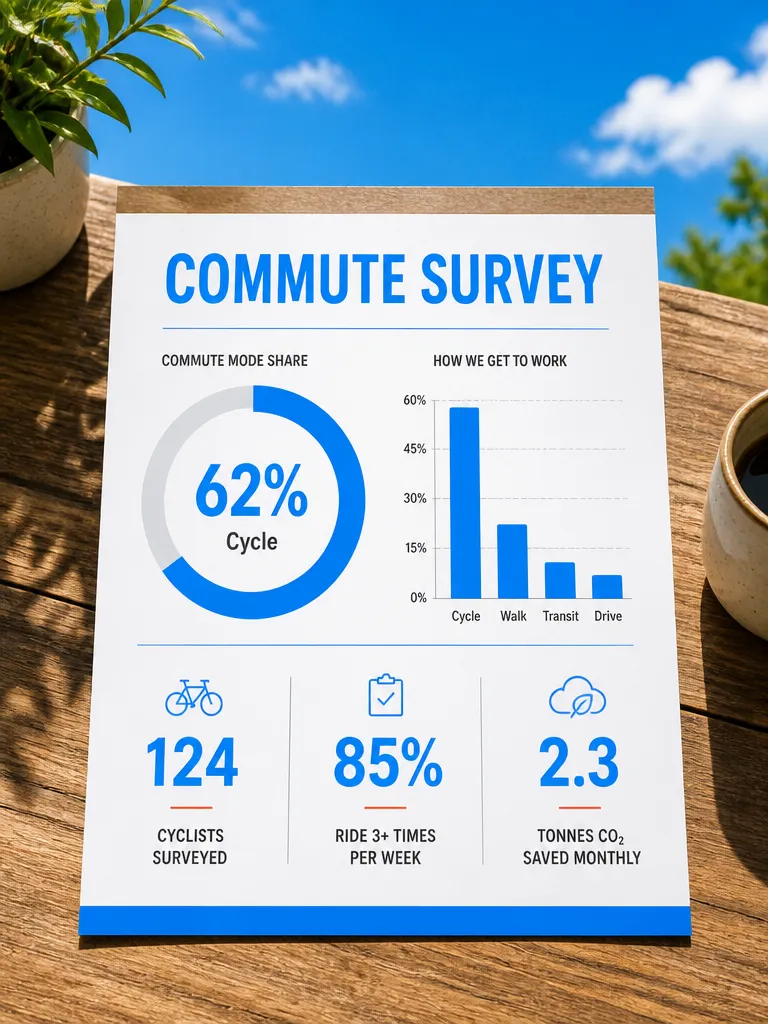 SpreadsheetInfographic
 - Every chart
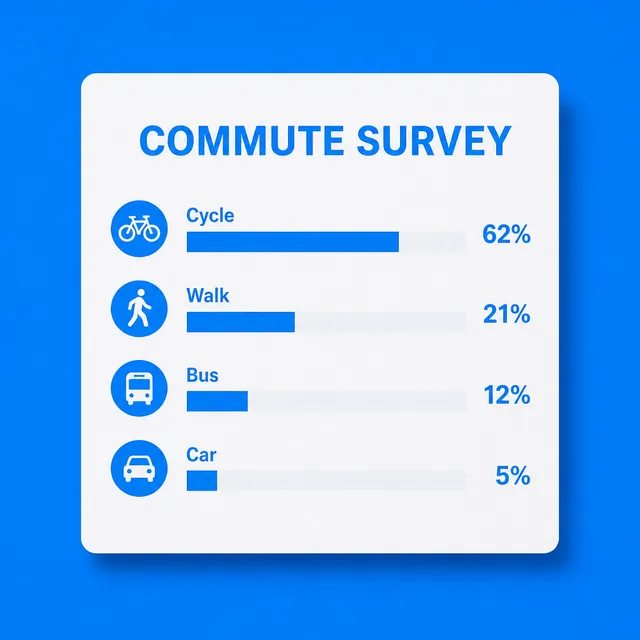 Bars
Bars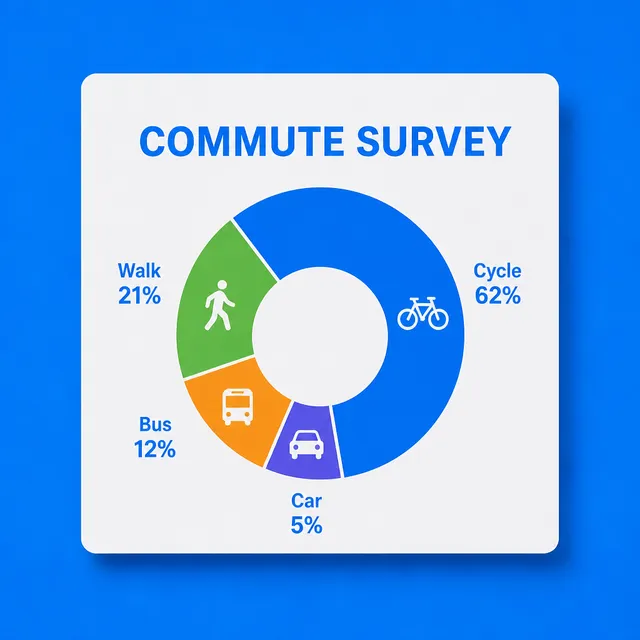 Ring
Ring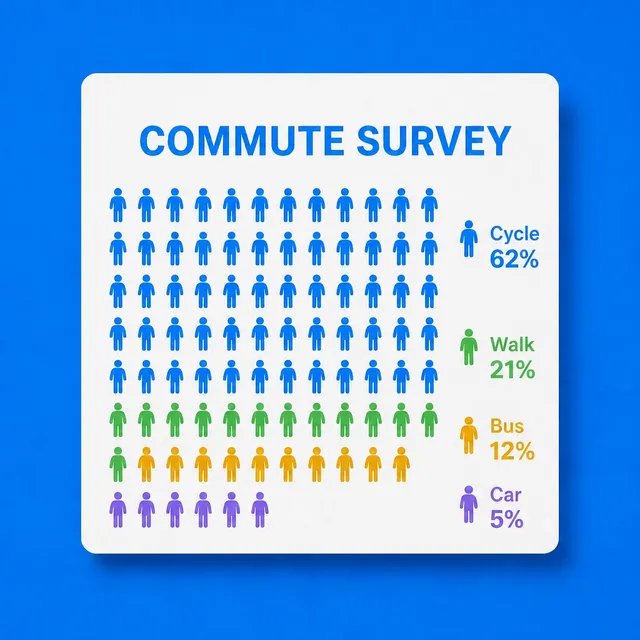 Pictogram
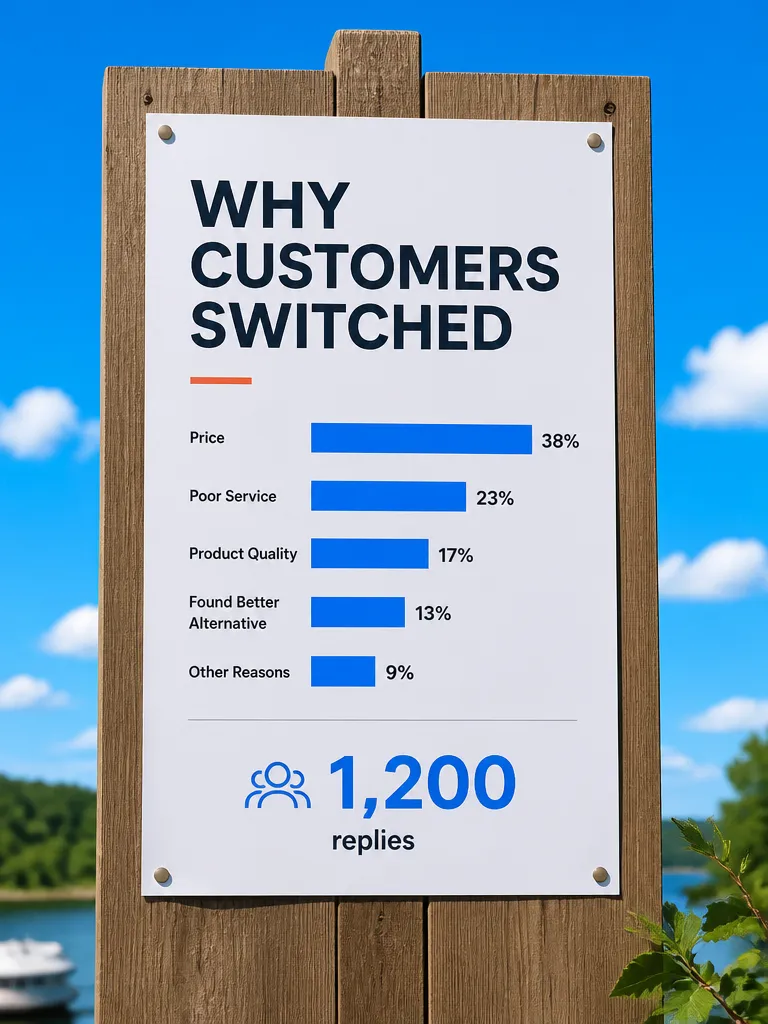
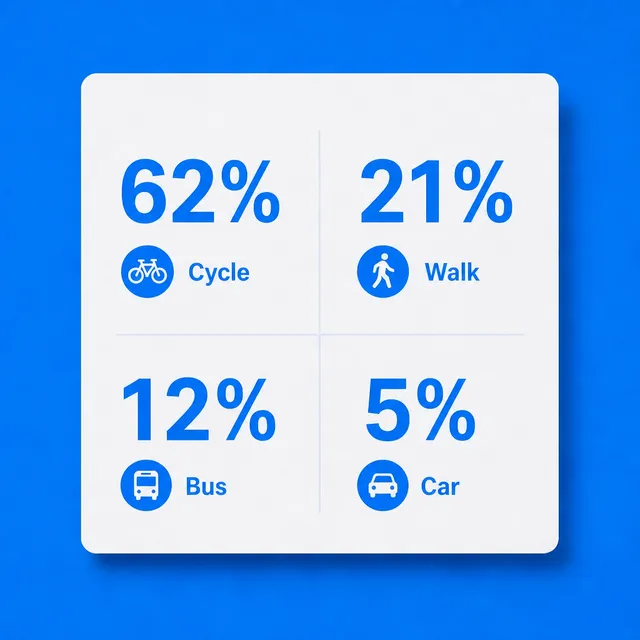 Big numbersCommute survey, 1,200 replies4 layouts
 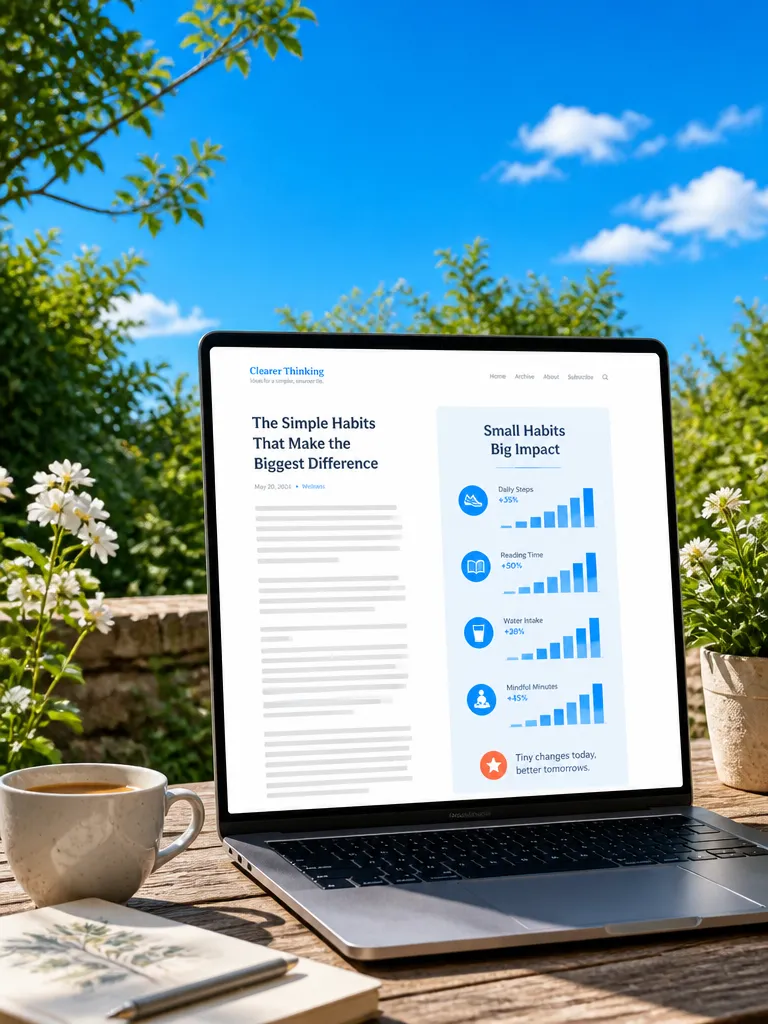 Blog
Blog Social post
 Classroom
 Slide
Slide
How it works

Paste the content
Numbers from a spreadsheet, a page of a report, survey results or a list of steps. EverAsk pulls out the figures and the points worth showing.

Choose the shape
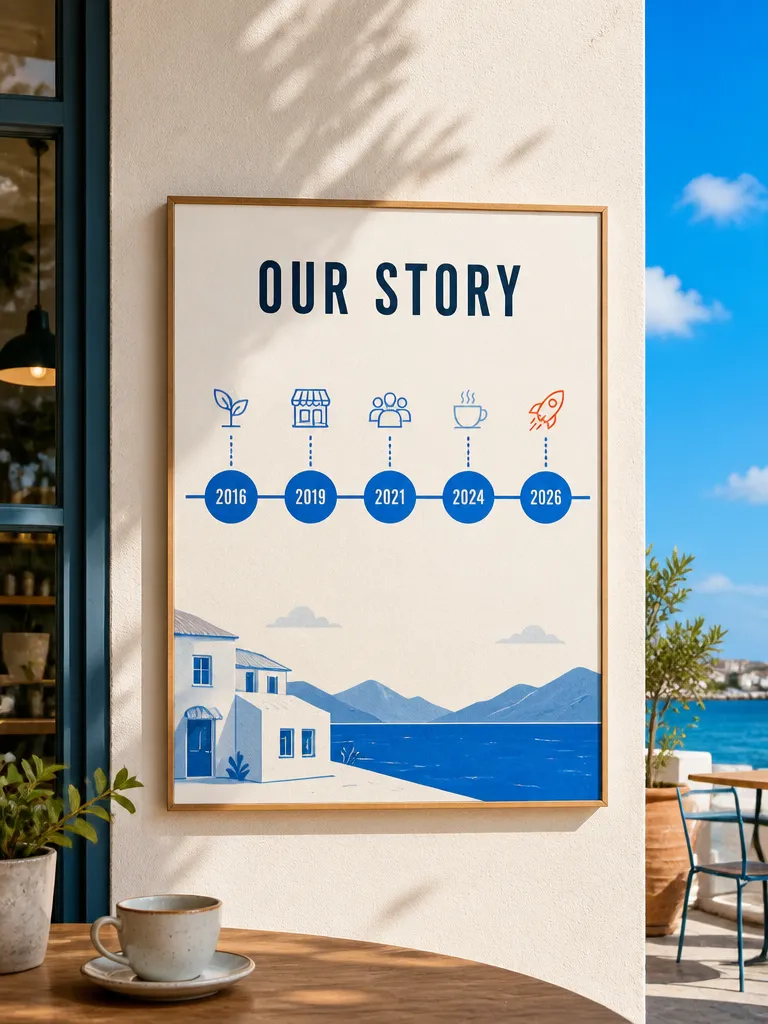
A tall one for a blog or Pinterest, a square for a feed post or a wide one for a slide. Pick a layout: a timeline, a comparison, a process or key stats.

Check and export
Every chart is drawn from your numbers and every label is editable. Fix a figure or a word, then download as an image or a PDF.
Features
Charts drawnto your data
Learn more about charts drawn to your dataLabels youcan edit
Learn more about labels you can editFrom a reportor a sheet
Learn more about from a report or a sheetLayouts forthe story
Learn more about layouts for the storyIn yourbrand
Learn more about in your brandSized forwhere it goes
Learn more about sized for where it goes
Who it’s for

Marketers and content teams
Turn a survey or a long report into a shareable visual that earns links and gets read past the first line.

Teachers and trainers
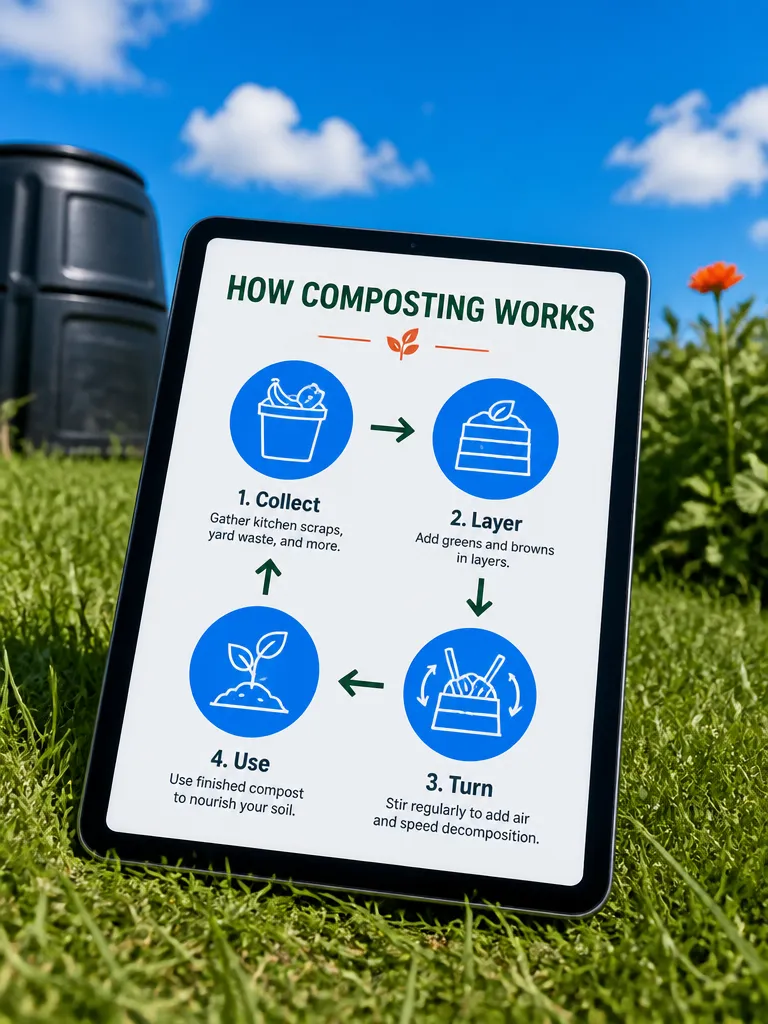
A process, a timeline or a set of facts on one page that a class can follow and pin to the wall.

Analysts and consultants
Put the three numbers that matter in front of a client on one clear page, instead of a forty-row table.
Frequently asked questions
Are the charts accurate to my numbers?
Yes. Charts are drawn from the figures you paste or upload, and you can check and edit every number before you export.
Can I edit the text after it is made?
Yes. Every heading, label and number is editable text, so you can change wording or fix a figure without redrawing anything.
Can I make an infographic from a PDF or a spreadsheet?
Yes. Upload a PDF report, a CSV or a doc and EverAsk pulls out the figures and key points to build the infographic from.
What formats can I download?
High-resolution PNG and JPG, and PDF for print, at tall, square and wide sizes.
Can it use my brand colours and fonts?
Yes. Set your brand kit once and every infographic uses your colours, fonts and logo.

One prompt in.
Real work out.
Infographics with charts drawn to your numbers.
EverAsk on your phone and your Mac
EverAsk for iPhone
Describe the picture on the train, pick the model, and post it from your phone. Every image you make here is on your phone.
Download on the App Store

EverAsk for Mac
AI Images on your desktop, with the reference photos and brand files you already have to hand.
Download for macOS